The first chart shows how respondents of the NES surveys identified themselves according to a 7-point scale of partisanship, from 'Strong Democrat,' to 'Independent,' to 'Strong Republican,' or simply 'Apolitical.' Note that these data go back to 1952, whereas data presented in the previous post on ideological identification went back only to 1972.

The next chart simplifies matters somewhat by showing responses to a 3-point scale of 'Democrat,' 'Independent,' or 'Republican.' Again, the data goes back to 1952.

The chart below shows linear trends in 3-point scale party identification. Note that to make the data on party ID easily comparable to that on ideological ID, this chart goes back only to 1972, not 1952.

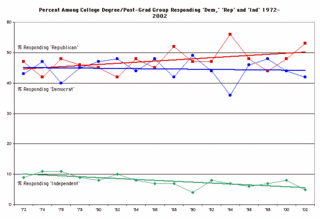
Finally, recapitulating the presentation on ideological ID, here are charts of the trends in party identification among the different education demographics groups. Comparisons between the fortunes of the Democrats and Republicans are easier when the data for each demographic group is considered separately.
This first chart looks at party identification among college graduates and post-graduates:

Working our way down the educational ladder, here is how party identification has broken down among NES respondents who have some college, but no degree:

High school graduates who have no college:

And finally, respondents who have some grade school or high school, but no high school diploma:

[Update: Frank's thesis pertains to loss of Democratic support among the White working class. The data presented here is not limited to that group, and so can only serve as background for evaluation of Frank's contention.]
Of course, one need not accept the NES data as the final word on the subject. Indeed, one large flaw in the percentages presented here is that I've not given the N of the educational groups. Those numbers can be found here, however, for those interested in reviewing them. The more statistically sophisticated might also quarrel with the way NES has weighted responses. These issues are beyond my grasp, sadly, but if you want to argue with the NES, information on their weighting methods can be found here.
While readers are digesting all these charts, I will be away from my computer until the weekend at the earliest. But after that, I will post more information from the NES, and, of course, respond to any comments.
No comments:
Post a Comment