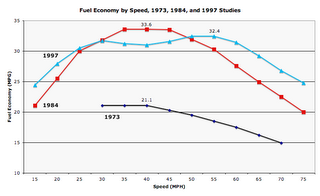
Looking again at the web page CL linked to in his post, I noticed that they do give sources for their data at the bottom of the page. For fuel efficiency they cite a study published in 1999, which I could not find online. But data from one done by the same authors, with the same title, in 1997-8 was available (probably it's the same study; you can download a PDF of the data here [chapter 7, p. 26], or see an image of the relevant table by clicking here). Using that data I constructed this graph:
 So studies on peak efficiency have been regularly repeated, but the most recent data is probably from 1997-98 model year cars. The peak efficiency for that year is 32.4 mpg in the 50-55 mph range. So 55 is still the peak, as far as we know, though peak efficiency speeds have been increasing: it was the 35-40 range in 1984, and 30-40 (the lowest speeds tested) in 1973.
It's also depressing to note, however, that the fuel efficiency at peak speeds has decreased from 33.6 mpg in 1984, to 32.4 in 1997-8.
1 comment:
Interesting data...the 1997 (most recent) line shows a relatively flat peak of fuel efficiency over the entire 30-60 MPH range. I didn't realize that was the case.
Post a Comment